Monday, January 29, 2007

Ophiolites


Ophiolites are one of my favorite types of rocks because they are very interesting to study and are extremely important in reconstructing past tectonic settings. An ophiolite is a stratified slab of oceanic crust that has been uplifted onto land and is then exposed with continental rocks. The word ophiolite comes from the Greek words "ophio" meaning snake, and "lite" meaning rock. Ophiolites are found in a distinct stratigraphic sequence which corresponds with its formation underwater. This sequence is as follows:


1. Sediments, usually black shale or chert

2. An extrusive sequence consisting of pillow basalts that were solidified by the ocean water. This also shows the magma-sea water contact

3. Sheeted dikes, which are vertical and parallel, which is also the origin of the pillow basalts

4. High level intrusive rock, usually isotropic gabbro which shows evidence of a fractured magma chamber

5. Layered Gabbro

6. Cumulative Peridotite which usually forms in dunite-rich mineral layers

7. Tectonized Peridotite which will normally be Harzburgite/Iherzolite-rich mantle rocks


These rocks are also very important in geological dating. By assessing the location of the ophiolites today, as well as analyzing the fossils/mircofossils found in the ophiolite, a timeline sequence can be created and in some cases, a good estimate of the ophiolite's original location can be described. These rocks were mentioned several times in a few different geology courses I have taken because the are applicable to many different areas of study. Ophiolites are also an important factor in interpretation geophysics. Since we have only explored the first 25% of the oceanic crust, these rocks can can prove very useful when comparing them to surroundings of in situ oceanic crust. Ophiolites have been found in various areas around the world such as:


-Joruma Ophiolites in Finland

-Troodos Ophiolites in Cyprus

-Vourinos and Pindos Ophiolites in Greece

-Semail Ophiolites in Oman and the United Arab Emirates

-Various types in various locations throughout Newfoundland

-Yakuno Ophiolites in Japan


Ophiolites can be divided into two groups: Tethyan and Cordilleran, based on their location. Tethyan ophiolites are found in the Eastern Medeterranian region while Cordilleran Ophiolites are normally found in the North American region. Though the two groups follow similar sequences, they are have individual characteristics specific to their region. Hopefully in the future, geologists can use these rocks to open more doors in the field of submarine geology and oceanic crust processes.

Friday, January 26, 2007

Cameron, Louisiana


When you think of hurricanes and Louisiana, the first one that comes to mind for most people is Katrina and its impact in New Orleans. However, the southern states were also hit by another monster storm, Hurricane Rita, only a month after Katrina. I found it interesting how the media viewed each hurricane depending on how it affected the public. Katrina was one of the most deadly and costly hurricanes in American history, however the storm was not as intense as Rita. Hurricane Katrina was formed on August 23, 2005 and made its way into the Gulf of Mexico before hitting land south of New Orleans. It had recorded wind speeds of 280 km/h. However, the most alarming fact is the 81.2 billion US$ in damages. It dissipated on August 31, 2005. However, I learned more about Rita during the summer, and was able to see the damages almost a year after the event. Rita was formed on September17, 2005 and made its way through the Gulf of Mexico along a similar course as Katrina, except Rita hit land a few hundred kilometers to the west of Katrina's path. It only killed 120 people (7 directly) and had 11.3 billion US$ in damages (in comparison to Katrina), however it affected people on the other side of the state in a similar fashion to Katrina in New Orleans. In my previous article, I had mentioned the town of Cameron, a port town on the Gulf coast of Louisiana. After I arrived in Louisiana and did a week of safety training courses, I made my way to Cameron to move into the boat and install the equipment and hardware we were going to use for our survey. The drive to the town is one that I will never, ever forget for the rest of my life. I was driving an SUV and was by myself for the two and half hour trek. When I was about 45 minutes from Cameron, I started driving south towards the coast. Louisiana is very flat due to its location relative to the Mississippi River. Over millions of years, the topography has been flattened due to the ever-fluctuating meander pattern of the river. While I drove south, I remember that the pavement for the road was elevated about 5 or 6 feet and there was water and swamp all around, though it was not very thick and I could see for a few kilometers in any direction. The road was relatively straight, and I remember I came to a huge opening and throughout the fields I could see houses scattered randomly. When Rita hit, there was a huge storm surge resulting in an 18 foot flood that had picked up the houses and moved them several kilometers. I remember that I had a very upsetting feeling and it was then that I actually realized what the storm must have been like. Before going to Cameron, I was told by some of my coworkers that it was one of the most devastated towns and that it was very intense. I did not have a camera for my drive, but like I said, it is a mental image that I will never forget. As I approached the town, it was like I was watching a movie. The town of Cameron is about the size of downtown Bridgewater ( 2000-3000 people) and after Rita hit, there were only a few buildings left standing. The town hall/library building was damaged, but held together. There was also a store, and the house of one of the richest men in the town. He had his house built on stilts 15 feet off the ground in case of a hurricane. Every other building in the town was demolished, some of them were actually the houses I had seen in the fields on my drive. The next day, I walked around the town by myself and took pictures of what I saw. As I began my work on the boat, some of the workers on the boat that were not part of our survey crew (there were two crews, the surveyors and the boat crew who were locals) had told me about the storm and how it had changed their lives. The town had been rebuilt, but it was all FEMA trailers. The thing I found most interesting was when I walked around the town, there were tons of properties that consisted of a concrete foundation with nothing on top, and a trailer set up beside the foundation, and a flagpole on almost every front lawn with an American flag. I thought about the fact that even though they had lost practicly everything, they still had some hope and some national pride. I know that this article is not exactly about the physical geography of the ocean, but I feel that it is definatly related since the Gulf of Mexico is a part of the lives of all the Cameron residents, and living in a close proximity to the ocean and hurricane territory was a risk that all the locals were willing to take. Also, I find it amazing that the water can rise up to 18 feet above normal sea level and stay like that for weeks on end. I have added some pictures from the day that I walked around. In a nutshell, the entire town looked like the houses in the pictures and this was 10 months after the storm.

Sunday, January 21, 2007

Side Scan Sonar Fish


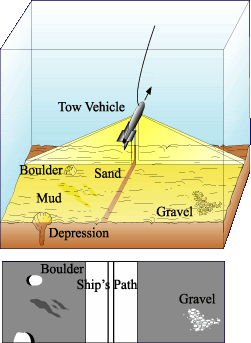
In this blog I am going to talk about Side Scan Sonar Technology and its application in my summer job. I knew nothing about sonar fish and related survey equipment. On the boat, we were running two "projects", a multibeam survey and a side scan sonar survey, though the two went hand in hand. There are a few different types of SSS fish, though the one that used primarily was the Klein 5000. It is rather large and heavy, and looks similar to a torpedo. The fish is towed behind the boat usually around 15m behind the stern. It has two receivers on either side about 3 feet long. The devise works by sending out hundreds-thousands of pings per second (a ping is a beam that is sent from the fish) and then calculating the return travel time (the amount of time it takes for the ping to leave the fish, bounce off the ocean floor, and return to the fish). By using this technique, it is possible to calculate the distance travelled by each individual ping, which results in a very detailed map, or bathymetry, of the ocean floor. There are many other factors involved in this process. For one, the velocity of each ping is greatly effected by the physical properties of the ocean water. The water is very diverse and can change greatly within only a few kilometers. To compensate for this issue, another devise called a seabird, is cast off the side of the boat. The seabird consists of two cylindrical shaped tubes that are held together by a metal frame. To use this devise, the boat has to come to a complete stop, and the seabird is manually lowered at a rate of 1m/second. Since the water is very shallow, it does not take very long until the seabird hits the ocean floor. While the seabird is lowered, it records the water pressure, temperature, salinity, current, etc with respect to water depth. This data is then uploaded to the ships computers where several graphs are made, as well as an algorithm that is applied to all of the data. This compensates for any unusual readings recorded by the SSS fish. The software accompanying the fish is capable of recording all of the pings and resulting bathymetry to result in a map of the ocean floor. The SSS operator has to be very careful when operating the equipment because if the water depth change, the fish could hit the bottom and possibly detach from the cable and be left on the bottom. Also, the range of the fish is proportional to its height from the floor (since the angle that the pings are sent is the same at any depth, and high fish altitude will result in a broader range). However, there is a small altitude range at which the fish can be and still receive a clear image. I have added an image of the fish I found from the web that gives a visual reference of how the fish works. Also, there is a picture of the fish on our boat and the A-frame that allows the workers to drop the fish off the back of the boat.

Wednesday, January 17, 2007

Summer Story... pt. 1


While in class today, I thought of an idea for my blogs. This summer, I was hired as a junior geologist for a company called Highland Geo Solutions, which is based out of Fredericton. Though I had anticipated on working in Fredericton for the summer doing sedimentary work on various local rivers, a week into the job my boss informed me that he had landed a contract with a company in Louisiana and that my collegue and I were going to be working in the south for the remainder of the summer. At the time, I was unsure of what was going to happen or what type of work we were going to be doing. It turned out that the company I was working for was called C & C Survey Technologies, a rather large Geophysical and Marine Survey company based out of Lafayette, La. There are several divisions in the company. I was working in the NOAA division. A few months before I arrived in Louisiana, C & C and NOAA (National Oceanographic and Atmospheric Administration) signed a contract for a continental shelf survey project of which I worked on all summer. The contract was worth upwards of 100 million dollars, and as the summer progressed, I became more aware of how important the work we were doing actually was to many groups of people. Basically, we had several mapped blocks of water that were within 500m-20km away from continental United States and Mexico, and we were performing both a Side Scan Sonar survey, as well as a multibeam survey. The port of Fourchon, which is located almost directly south of New Orleans on the Gulf Coast, is one of the largest and most trafficked ports in the Gulf. Directly south of Fourchon is one of the most congested areas of the gulf with the extremely high frequency of traffic as well as hundreds to thousands of oil rigs and satellite gas platforms (I remember one morning I went on the top deck and counted 110 platforms/rigs that I could see within view of our boat). When Hurricane Katrina ran its course towards New Orleans, many of these platforms and rigs were damaged. Since the petroleum companies were aware of the impending storm, all of the platforms and rigs were turned off and evacuated, however many of them were damaged and there was debris that had sunk to the bottom and was proving to be hazard to boats going in and out of Fourchon. As well, the water within a few km was very shallow (usually between 20-35m), so if there were pipes or other material on the ocean floor, it was very possible for the boats to be struck. Anyway, my idea for my blog was to divide the many different parts of my summer, as well as what I learned while living on the boat, and write several blogs detailing several individual topics. I think that it will be a good way for me to write down my memories from the summer, as well as allow readers to gain an understanding of what life is like on a boat, and how different technologies are advancing in the field of oceanography and marine survey. As well, I think it is important for people to understand how greatly the people of Louisiana, Texas, Mississippi, Alabama, etc, were affected by the storm. The one thing I learned this summer that I find the most valuable is how ineffective CNN is at depicting events such as the Katrina disaster, Hurricane Rita, etc. Perhaps it isn't that CNN is no effective, but that we as a society as so used to watching television that it almost as if we watch the events occur on the screen, but since we are not there to experience them, it does not really hit home. I was able to meet many people that lost their home, every belonging that they had to their name, and were only left with their wives and children and the hope that one day things would be alright. (The picture at the top is in Cameron, a port town just south of Lake Charles and about a 45 min drive from the Texas/Louisiana border)

Monday, January 8, 2007

First Blog...

Well this is my rookie blog. During our first lecture in the class, we talked about the history of Oceans. Some of the material was interesting. I found the part regarding the melting glaciers particularly interesting. It also made me think about how mild of a winter we have had so far, and that there are noticeable changes in climate in the last short period (my lifetime). There are so many theories postulated regarding the change in climate and its affect on mean sea level. It is hard to comprehend the severity of this problem, and in turn, the steps that will be required to compensate for such issues. The part I find particularly intriguing is the interconnectedness of the many subsystems that that are under the influence of the rising sea level. For example, a change in sea level can effect local and regional climates, marine and maritime wildlife, transportation which can effect economy, etc. The most troubling fact is that we are unable to predict how our world will change. The only steps we are able to take to prevent such problems are to reduce our greenhouse gas emmissions and to conduct further research in this study area to try and hypothesize what may occur.